Traces and logs in your own database.
A free .NET library that writes OpenTelemetry traces and logs straight into SQL Server, PostgreSQL, MySQL, MongoDB or SQLite, and gives you a dashboard inside your app. No collector, no migrations, no account.
Free, including commercial use · .NET 9 and later · NuGet 3.0.0: View on NuGet
Pick your database
The tables are created on first start, in their own schema, so it can share the database your app already uses.
- SQL Server: On first start the library creates its tables under the powertraces schema: spans, logs, a summary row per trace and the search index. Several instances can start at once.
- PostgreSQL: On first start the library creates its tables under the powertraces schema, guarded by an advisory lock so several instances can start at once. Rows are written with binary COPY.
- MySQL / MariaDB: On first start the library creates its tables in the powertraces database, guarded by GET_LOCK so several instances can start at once.
- MongoDB: On first start the library creates collections prefixed with powertraces_ and the indexes the dashboard needs.
- SQLite: On first start the library creates the file and its tables, and switches it to WAL so the dashboard reads while the exporter writes. No database server needed.
dotnet add package PowerTraces.MSSQL
dotnet add package PowerTraces.Dashboard
dotnet add package OpenTelemetry.Extensions.Hosting
dotnet add package OpenTelemetry.Instrumentation.AspNetCore

using OpenTelemetry.Logs;
using OpenTelemetry.Trace;
using PowerTraces;
using PowerTraces.Dashboard;
using PowerTraces.MSSQL;

builder.Services.AddOpenTelemetry()
    .WithTracing(t => t
        .AddAspNetCoreInstrumentation()
        .AddPowerTracesMsSqlExporter(connectionString, o => o.ExcludePathPrefixes.Add("/otel")))
    .WithLogging(l => l.AddPowerTracesMsSqlExporter(connectionString));

builder.Services.AddPowerTracesMsSqlDashboard(connectionString);

var app = builder.Build();
app.MapPowerTracesDashboard("/otel", PowerTracesDatabaseProvider.SqlServer);
What you get inside your app
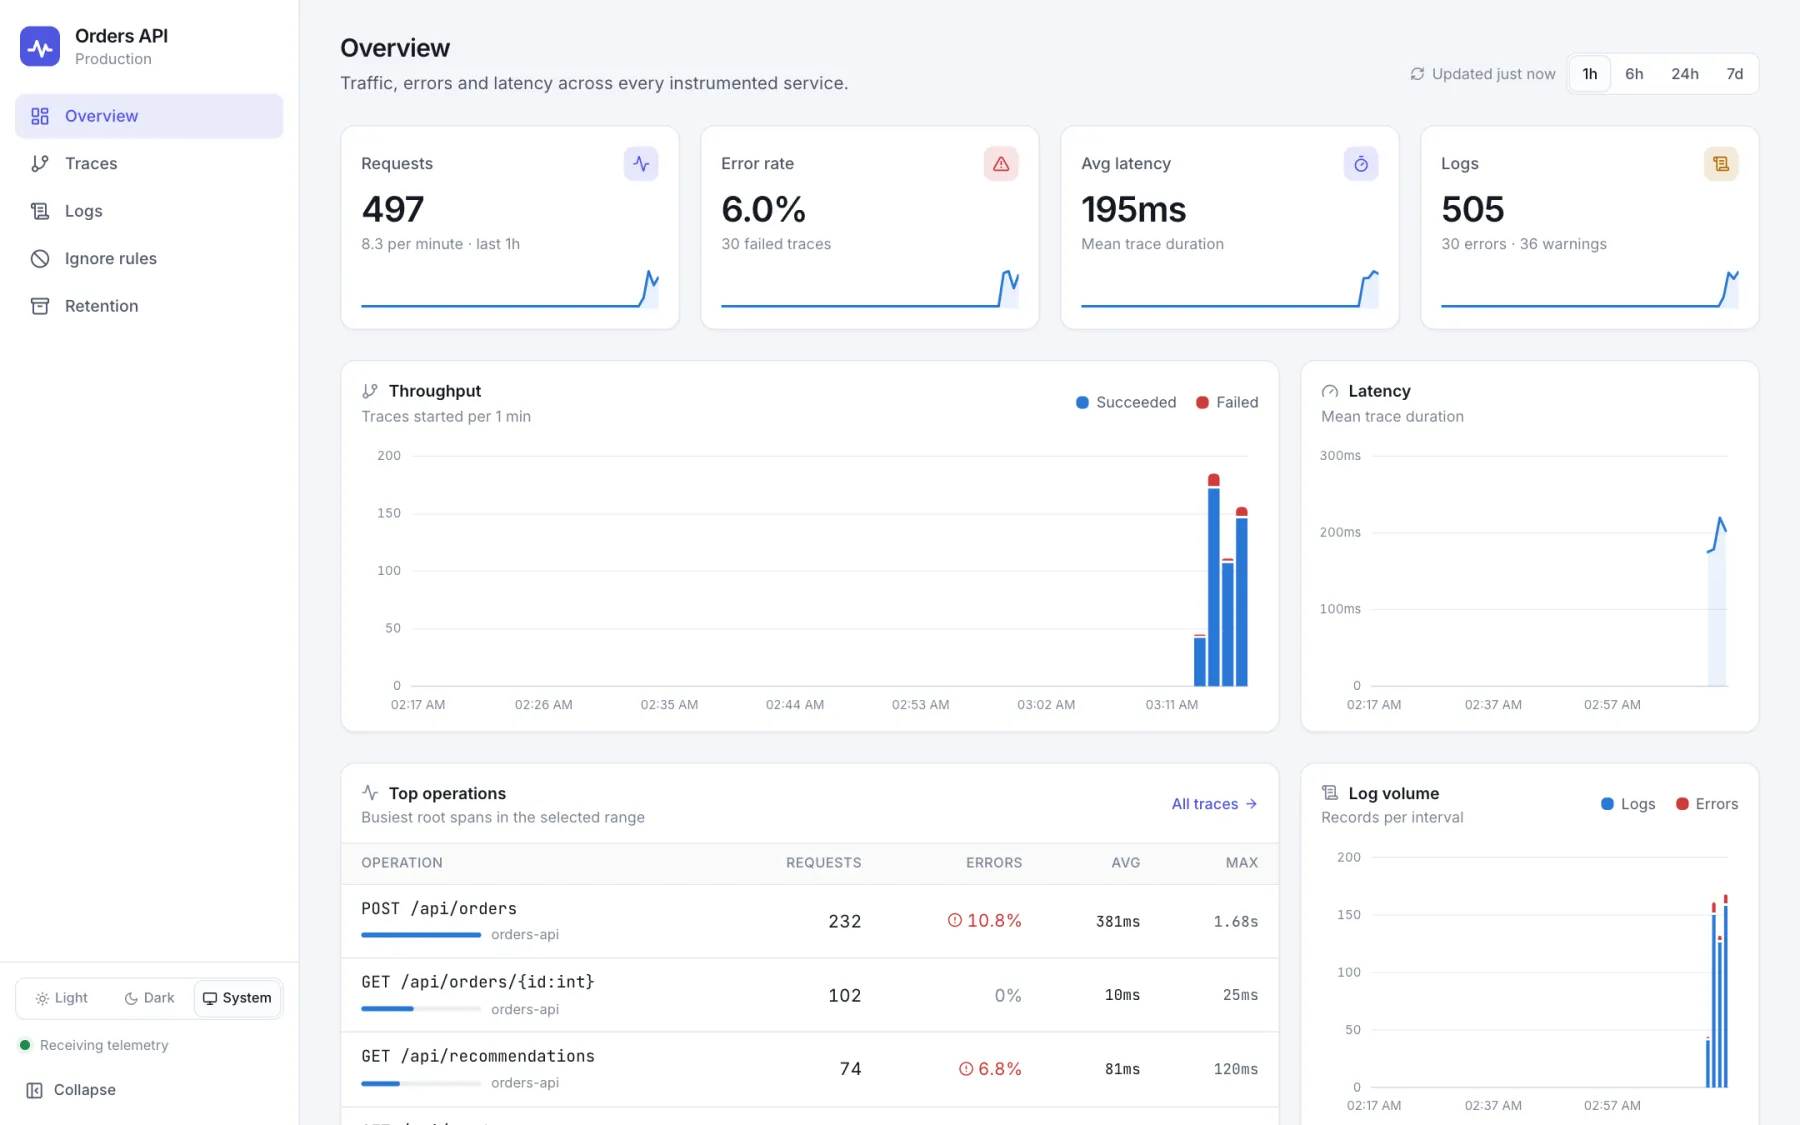
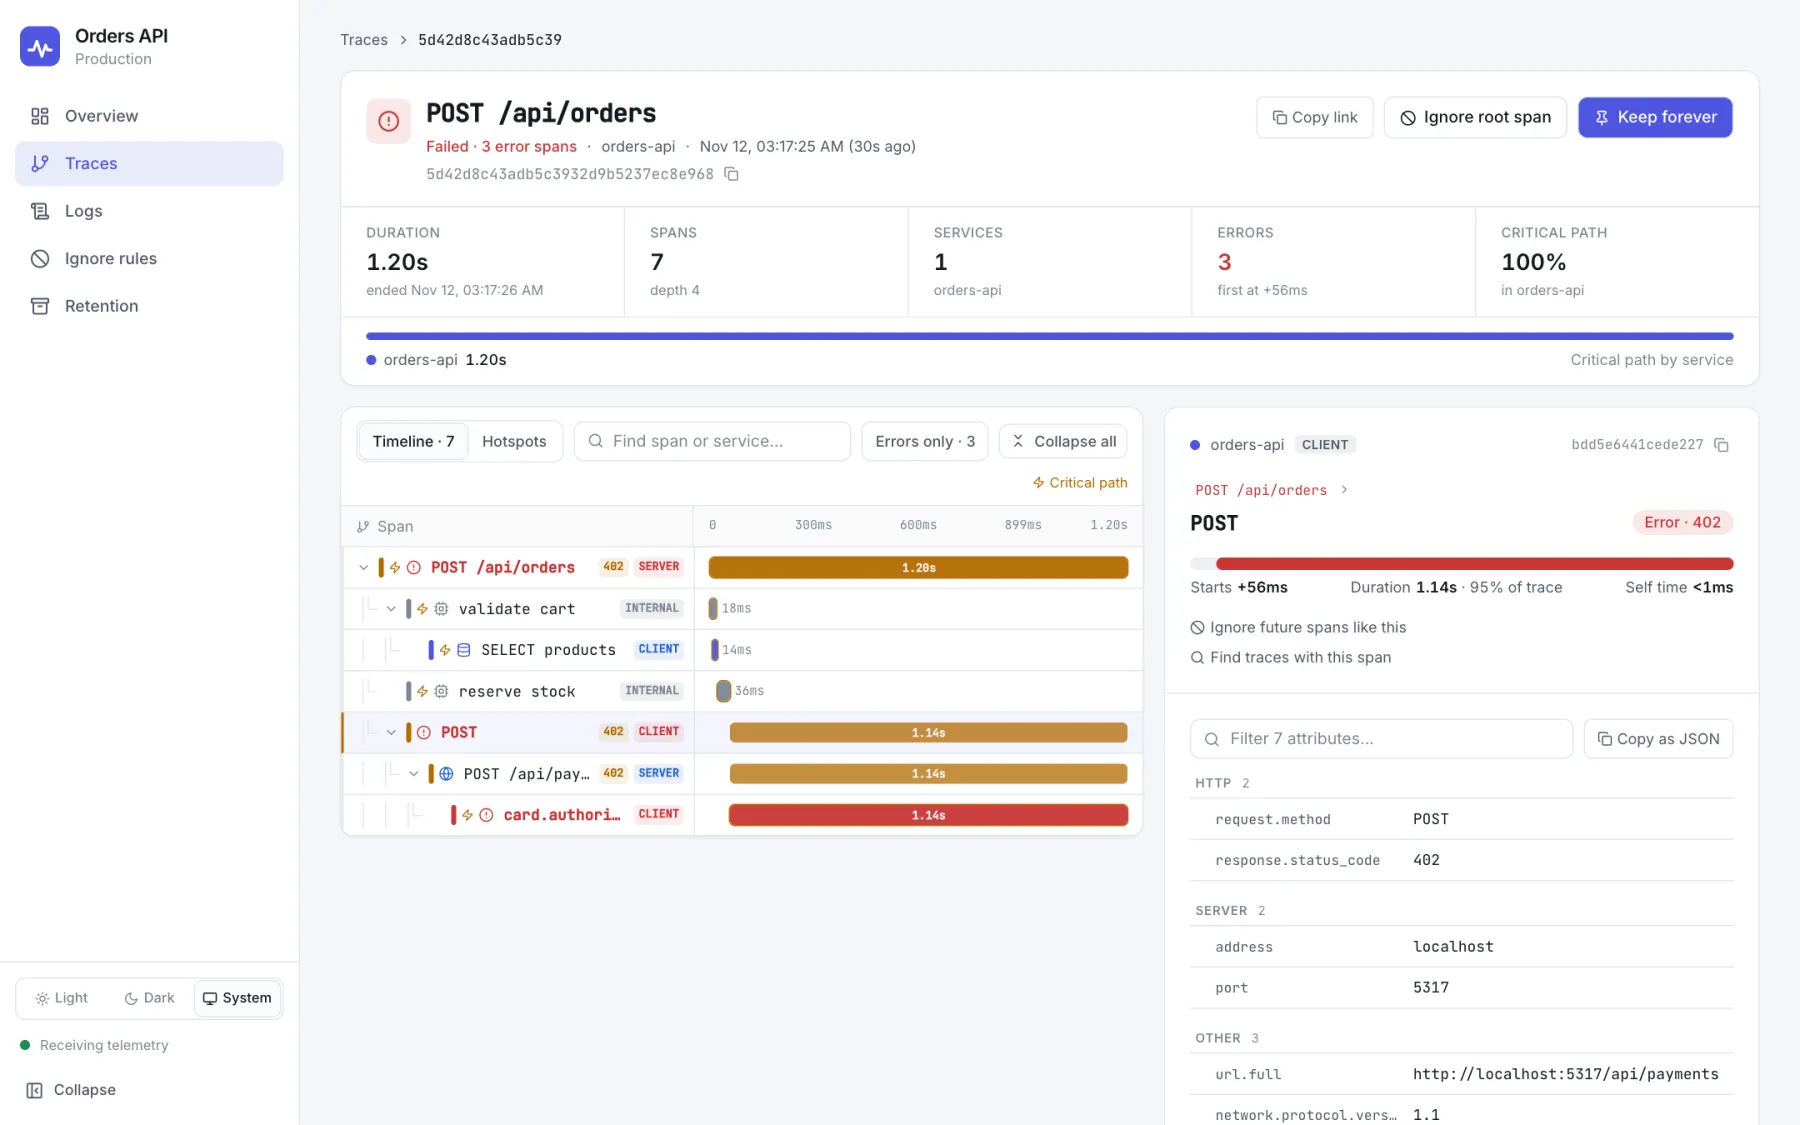
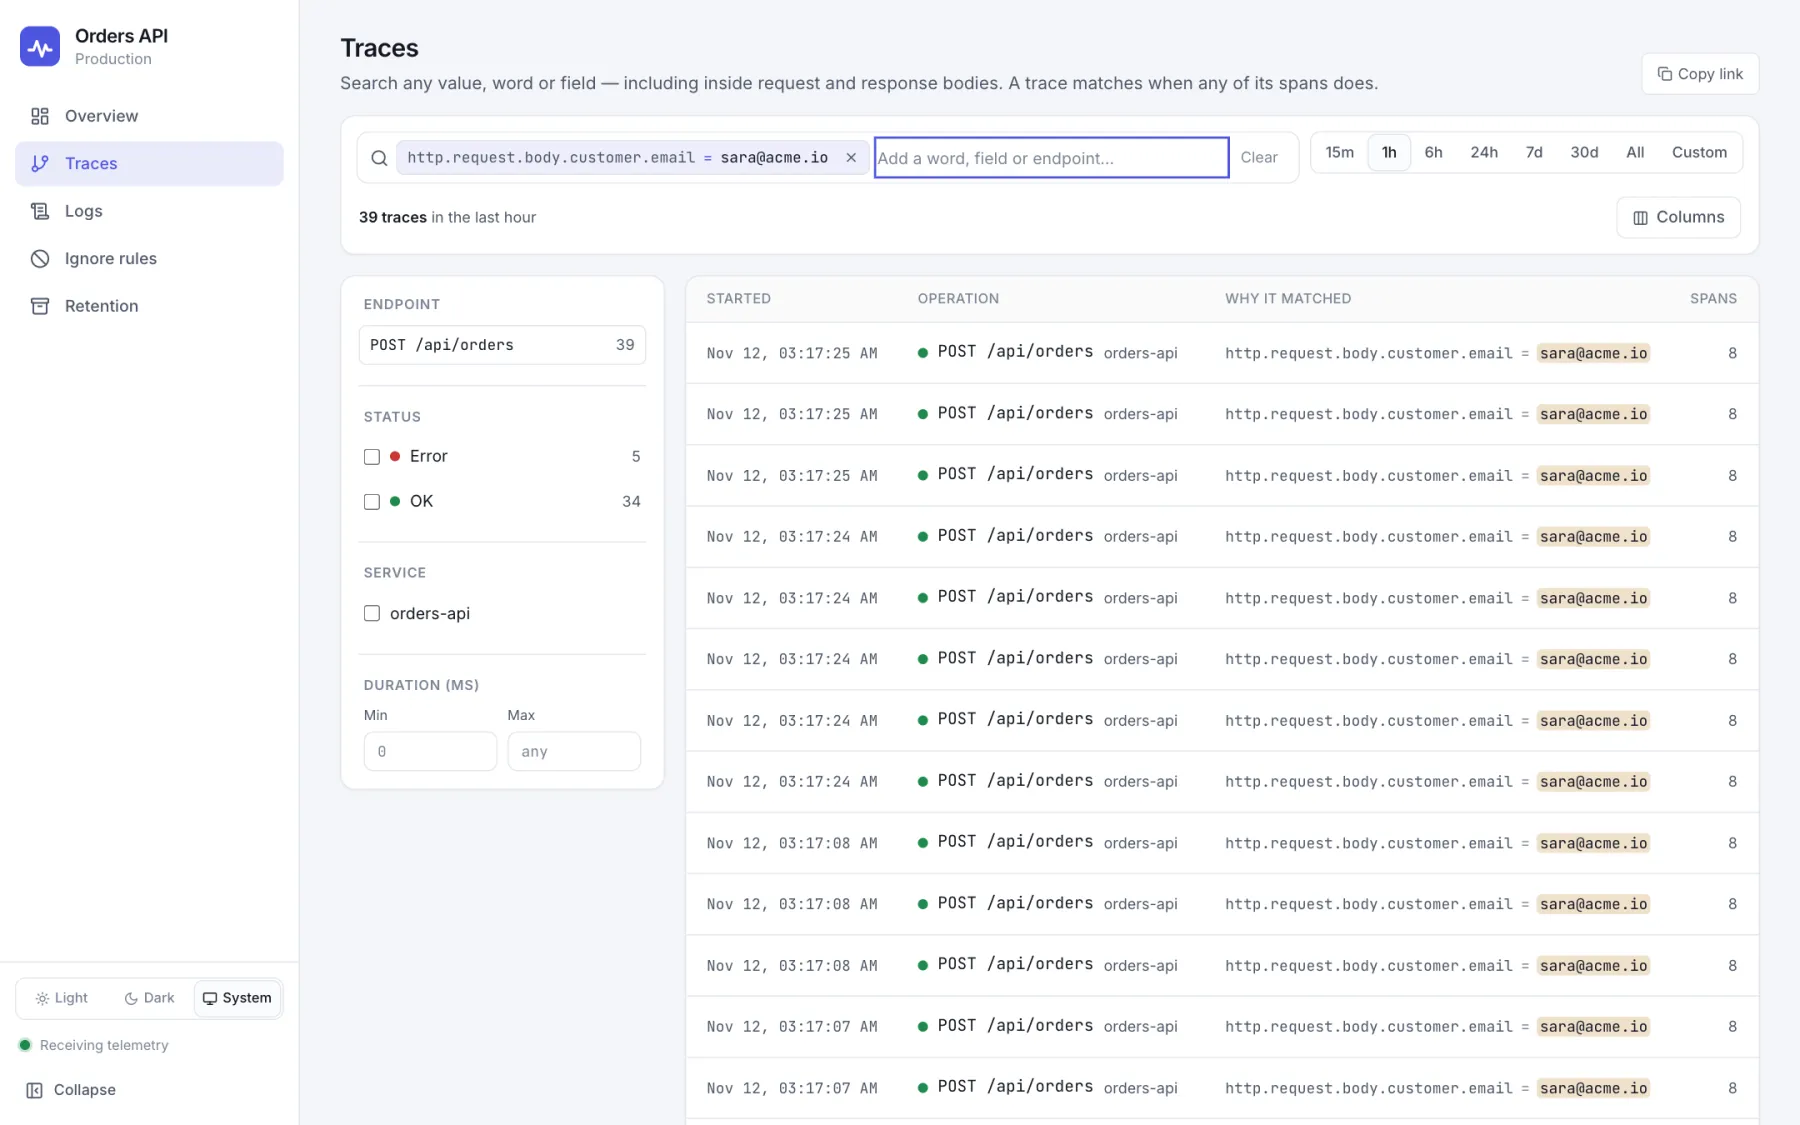
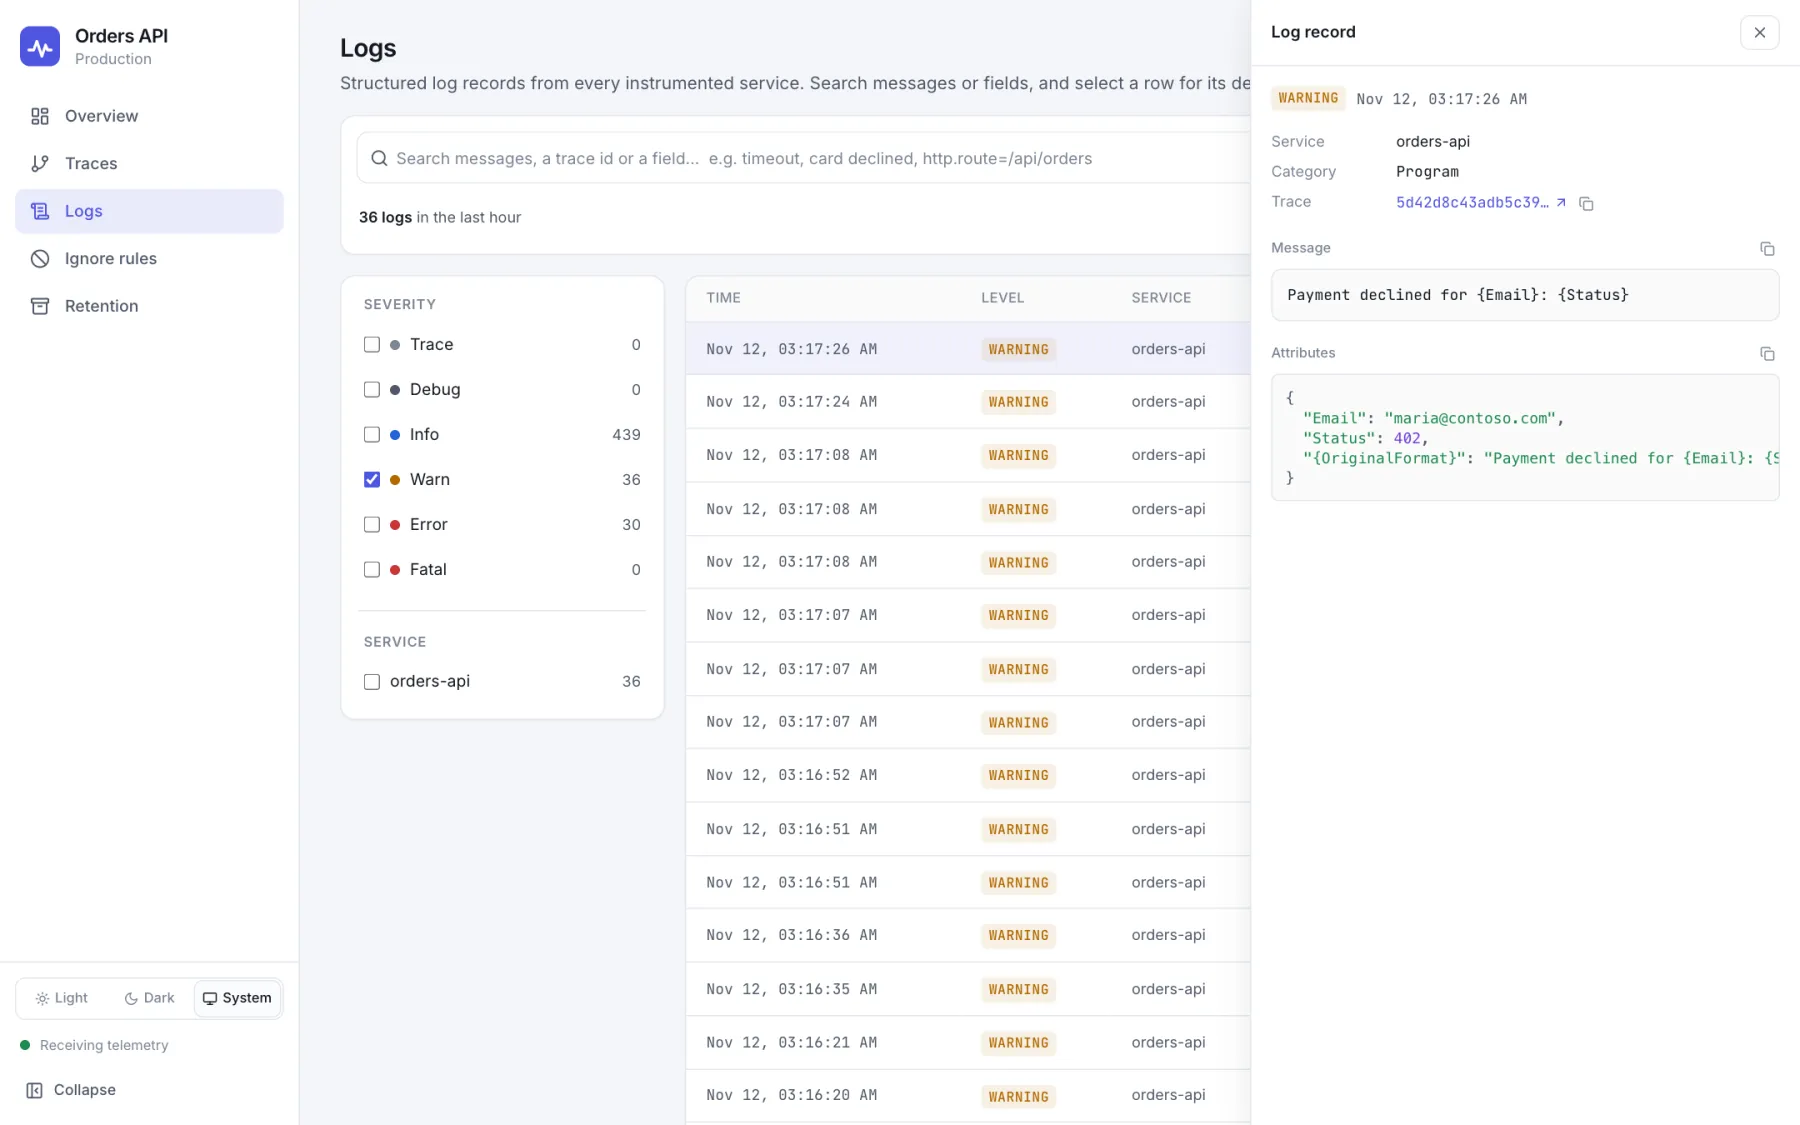
Screenshots from a sample orders API using the SQLite provider, at /otel.
An OpenTelemetry exporter that writes to a database
Your app keeps using standard OpenTelemetry. Instead of sending spans and logs to a collector, PowerTraces writes them in batches, in the background, to the database you point it at. The dashboard reads the same tables.
- Your .NET app: ASP.NET Core, workers, anything that uses OpenTelemetry.
- PowerTraces exporter: Batches off the request path, and applies ignore rules before writing.
- Your database: Spans, logs, trace summaries and a search index, in their own schema.
- Dashboard at /otel: Embedded in the package. Nothing else to deploy.
Everything you need to debug one app
- Overview: Requests, error rate, latency and log volume for the last hour to 7 days, the busiest operations, recent failures and the latest logs.
- Traces: Filter by endpoint, status, service and duration with counts, and add any attribute as a column.
- Trace detail: The span tree on a time axis with the critical path highlighted, grouped attributes, sensitive values masked, and where it failed.
- Logs: A filterable log stream by time, service, severity and attribute, linked to the trace each line belongs to.
- Ignore rules: Stop storing health checks and noisy spans from the dashboard, without a redeploy. Applied before writing.
- Retention: Keep traces and logs for as long as you choose, keep failures regardless, and pin traces to keep forever.
Get more out of every trace
Four things teams add in their first week. Each one is a few lines of standard OpenTelemetry in your own code.
Record request and response bodies
Add a small middleware that copies JSON bodies onto the request span as http.request.body and http.response.body. PowerTraces splits any JSON attribute into fields, so you can search a value inside a body.
app.UseBodyCapture();

public static class BodyCapture
{
    private const int MaxBody = 32 * 1024;

    public static IApplicationBuilder UseBodyCapture(this IApplicationBuilder app) => app.Use(async (context, next) =>
    {
        var activity = Activity.Current;
        if (activity is null) { await next(); return; }

        if (IsJson(context.Request.ContentType))
        {
            context.Request.EnableBuffering();
            using var reader = new StreamReader(context.Request.Body, leaveOpen: true);
            activity.SetTag("http.request.body", Limit(await reader.ReadToEndAsync()));
            context.Request.Body.Position = 0;
        }

        var original = context.Response.Body;
        using var buffer = new MemoryStream();
        context.Response.Body = buffer;
        try
        {
            await next();
        }
        finally
        {
            if (IsJson(context.Response.ContentType))
                activity.SetTag("http.response.body", Limit(System.Text.Encoding.UTF8.GetString(buffer.ToArray())));
            buffer.Position = 0;
            await buffer.CopyToAsync(original);
            context.Response.Body = original;
        }
    });

    private static bool IsJson(string? type) => type?.Contains("json", StringComparison.OrdinalIgnoreCase) == true;
    private static string Limit(string text) => text.Length > MaxBody ? text[..MaxBody] : text;
}
- Search a field inside a body: http.request.body.customer.email = sara@acme.io.
- Fields named password, token, secret, authorization or cookie are masked in the dashboard, but they are still stored. Leave out endpoints such as sign-in, or remove those fields before you set the tag, if they must never reach the database.
- Bodies are cut at 32 KB. The middleware buffers the response, so skip it for file downloads and streamed responses.
Trace your own services and repositories
Create an ActivitySource for each area of your code and start an activity in the methods you want to see. They appear as spans inside the request that called them.
builder.Services.AddOpenTelemetry()
    .WithTracing(t => t
        .AddSource("Shop.*")
        .AddAspNetCoreInstrumentation()
        .AddPowerTracesSqliteExporter(telemetry));

public sealed class OrderService(IOrderRepository orders)
{
    private static readonly ActivitySource Source = new("Shop.Orders");

    public async Task<Order> PlaceAsync(Cart cart, CancellationToken ct)
    {
        using var activity = Source.StartActivity("OrderService.Place");
        activity?.SetTag("cart.items", cart.Items.Count);
        return await orders.InsertAsync(cart, ct);
    }
}

public sealed class OrderRepository(IOrdersDb db) : IOrderRepository
{
    private static readonly ActivitySource Source = new("Shop.Data");

    public async Task<Order> InsertAsync(Cart cart, CancellationToken ct)
    {
        using var activity = Source.StartActivity("OrderRepository.Insert", ActivityKind.Client);
        activity?.SetTag("db.system.name", "postgresql");
        var order = await db.SaveAsync(cart, ct);
        activity?.SetTag("order.id", order.Id);
        return order;
    }
}
- Register your sources with AddSource. A wildcard such as "Shop.*" covers them all; without it, the spans are dropped.
- StartActivity returns null when nothing is listening, which is why the code uses ?. on activity.
- Use ActivityKind.Client for calls that leave your process, such as a database, an HTTP API or a queue. Add IDs you will search for later, like order.id, as tags, and never add secrets.
Record every SQL command, from ADO.NET or EF Core
Add the instrumentation for your database driver. Each command becomes a span with its SQL text in db.query.text, under the code that ran it. EF Core runs through the same drivers, so it is covered too.
# SQL Server (Microsoft.Data.SqlClient, also under EF Core)
dotnet add package OpenTelemetry.Instrumentation.SqlClient
# PostgreSQL (Npgsql, also under EF Core)
dotnet add package Npgsql.OpenTelemetry
# MySQL and MariaDB: MySqlConnector traces itself, nothing to install
# Any other EF Core provider
dotnet add package OpenTelemetry.Instrumentation.EntityFrameworkCore --prerelease
builder.Services.AddOpenTelemetry()
    .WithTracing(t => t
        .AddAspNetCoreInstrumentation()
        .AddSqlClientInstrumentation(o => o.RecordException = true)
        .AddNpgsql()
        .AddSource("MySqlConnector")
        .AddPowerTracesSqliteExporter(telemetry));
- Parameter values are not recorded. SqlClient can add them with SetDbQueryParameters; leave it off when they may hold personal data.
- Use the driver instrumentation, or the EF Core instrumentation for providers that have none, not both, or every command appears twice.
- The library’s own writes to its tables are never traced.
Mark a trace as failed
In a catch, call RecordExceptionWithSource: it records the exception and marks the span as failed. For failures that aren't exceptions, set the span's status to Error. If any span in a trace fails, the whole trace counts as failed in the trace list, the overview and the error filters.
using System.Diagnostics;
using PowerTraces;

public sealed class PaymentService(IPaymentGateway gateway)
{
    private static readonly ActivitySource Source = new("Shop.Payments");

    public async Task ChargeAsync(decimal amount, CancellationToken ct)
    {
        using var activity = Source.StartActivity("PaymentService.Charge");
        try
        {
            await gateway.ChargeAsync(amount, ct);
        }
        catch (Exception ex)
        {
            activity.RecordExceptionWithSource(ex);
            throw;
        }
    }

    public void Declined(string reason)
    {
        Activity.Current?.SetStatus(ActivityStatusCode.Error, reason);
        Activity.Current?.SetTag("payment.decline_reason", reason);
    }
}
- RecordExceptionWithSource (version 3.0.0 and later) also saves the code around each line of your app the exception passed through. The trace page shows it with the failing line marked and inner exceptions as “Caused by”. On 2.0.x, use activity?.SetStatus(ActivityStatusCode.Error, ex.Message) and activity?.AddException(ex).
- To see the code in production, add <EmbedAllSources>true</EmbedAllSources> to your project. To add it to exceptions that ASP.NET Core and other instrumentation record too, set CaptureSourceSnapshots = true on the exporter. Both put source code into your telemetry database.
- ASP.NET Core instrumentation already marks 5xx responses as failed. A 4xx such as a declined payment isn't, unless you set it, as Declined does.
One search box, down to a field inside a request body
Search any word, value or field across span names, attributes, events and JSON bodies. Each result shows which field matched.
declined: A word anywhere in the trace"card declined": Every word of the phrase-health: Must not containhttp.response.status_code=500: A field equals a valuehttp.request.body.customer.email = sara@acme.io: A field inside a JSON body
Fast on millions of spans
The trace list reads a summary kept up to date on write, and search uses an index written next to the spans, so cost follows the matches, not the table size.
- 7 ms (2.6 s): Trace list on SQL Server with 1.2 million spans.
- < 40 ms (22 s): Searching 100,000 traces for an email inside the request body, on MariaDB.
- +4–17%: Total database size with the search index, offset by compressing large attributes.
Built for each engine
- SQL Server: Search terms in a page-compressed table clustered on term, time and trace.
- PostgreSQL: A GIN-indexed tsvector on the trace summary; rows written with binary COPY.
- MySQL / MariaDB: A FULLTEXT-indexed column on the trace summary.
- MongoDB: A multikey-indexed term array on each trace document.
- SQLite: A local file in WAL mode, with a clustered search terms table.
Using another database? Implement IStorageWriter and IDashboardStore. The built-in providers use the same public interfaces.
Start free. Move to PowerTraces when one app becomes many.
| .NET library | PowerTraces | |
|---|---|---|
| Price | Free, including commercial use | Free trial, then paid |
| Where data lives | Your database | Our cloud, or your servers on-prem |
| Traces and logs | Yes | Yes |
| Metrics | No | Yes |
| Languages | .NET | .NET, Node.js, browser and any OpenTelemetry SDK |
| Many services in one view | Apps sharing a database | Yes, across teams and workspaces |
| SLOs, alerts and revenue impact | No | Yes |
Questions
Is it really free?
Yes. Use it in any app, including commercial ones, and ship it inside your product. No account or key is needed. The license doesn't allow changing the library's code; configure it with its options or extend it through its public interfaces instead.
Will it slow my app down?
Spans and logs are exported in batches by OpenTelemetry's batch processor, off the request path. The library's own database calls are never traced.
Can it use the database my app already has?
Yes. Its tables live in their own schema, so they never mix with yours. You can also give it a separate database.
Can several apps write to the same database?
Yes. Table creation is lock-guarded, and ignore rules and retention are stored in the database, so every app follows them.
How do I protect the dashboard?
Pass a user name and password to MapPowerTracesDashboard, or mount it behind your own authentication.
How do I move to PowerTraces later?
Both use OpenTelemetry, so your instrumentation stays as it is. Replace the exporter lines with the PowerTraces.cs file from Get started in PowerTraces, and call builder.AddPowerTraces().
Outgrowing one database?
PowerTraces brings every service, language and signal into one place, with SLOs, alerts and the business impact of each error.